
PRODUCT TREND MATRIX
THE TOOL
My passion when working with data is optimizing categorization to quickly monitor growth as well as emerging interest. One of the greatest issues when working with text-based data, such as product names, headlines, product reviews, product descriptions, social comments, meta captions, etc. is categorizing all the topics addressed into groups of more and more refined themes, aka Topics.
The Product Trend Matrix is a tool I created that cleans, transforms, clusters, and then categorizes text data using AI prompt engineering. It allows any text-based data to be transformed into an interactive dashboard of category specific trends as well as interactive clustered topics in various visualizations, such as bar charts, UMAPS, and sankey diagrams—all of which is filterable to specific categories to holistically visualize the universe of all your data.
I have vibe-coded several iterations of the Product Trend Matrix via Replit, Manus.AI, Lovable, and TempoLabs, which are available for a demo upon request. With these web tools, you can interactively explore trends and trend topics of your text-based data that correlate to revenue and engagement performance.
Below are screenshots from the earliest versions of the Product Trend Matrix when it still lived in as a Python script in Google Colab.
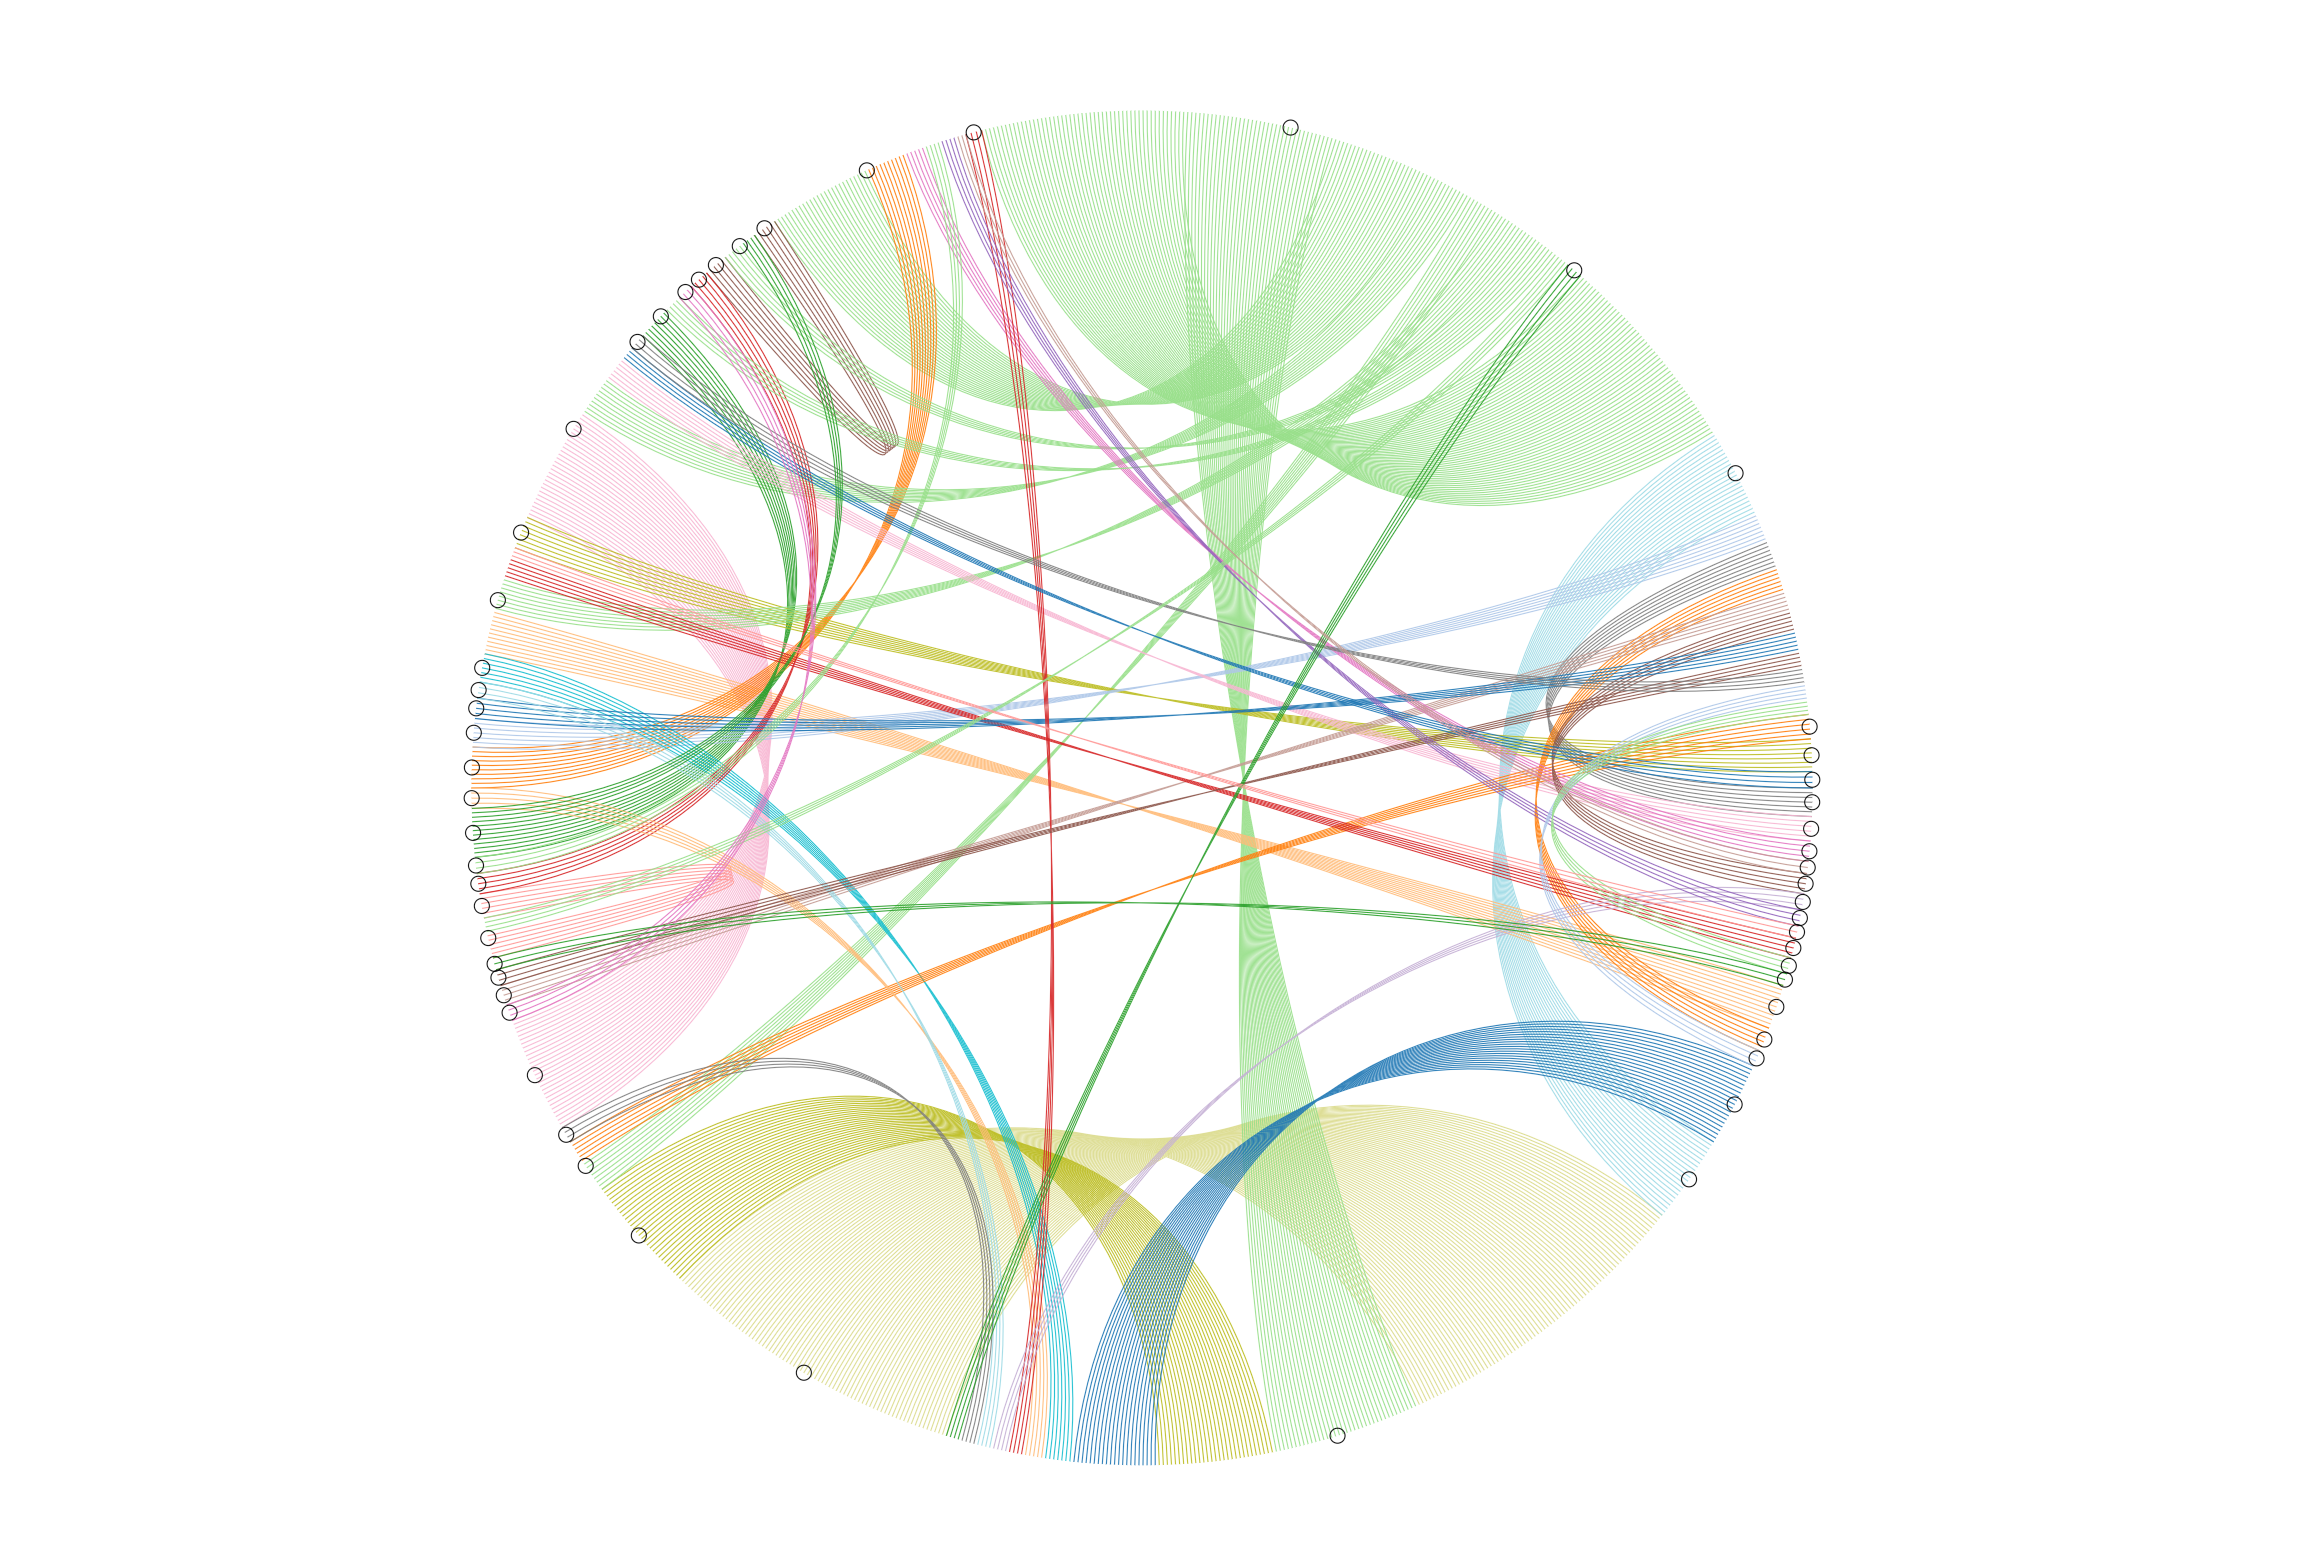
The Slankey Diagram - Product conversion data visualized from Spring 2023.
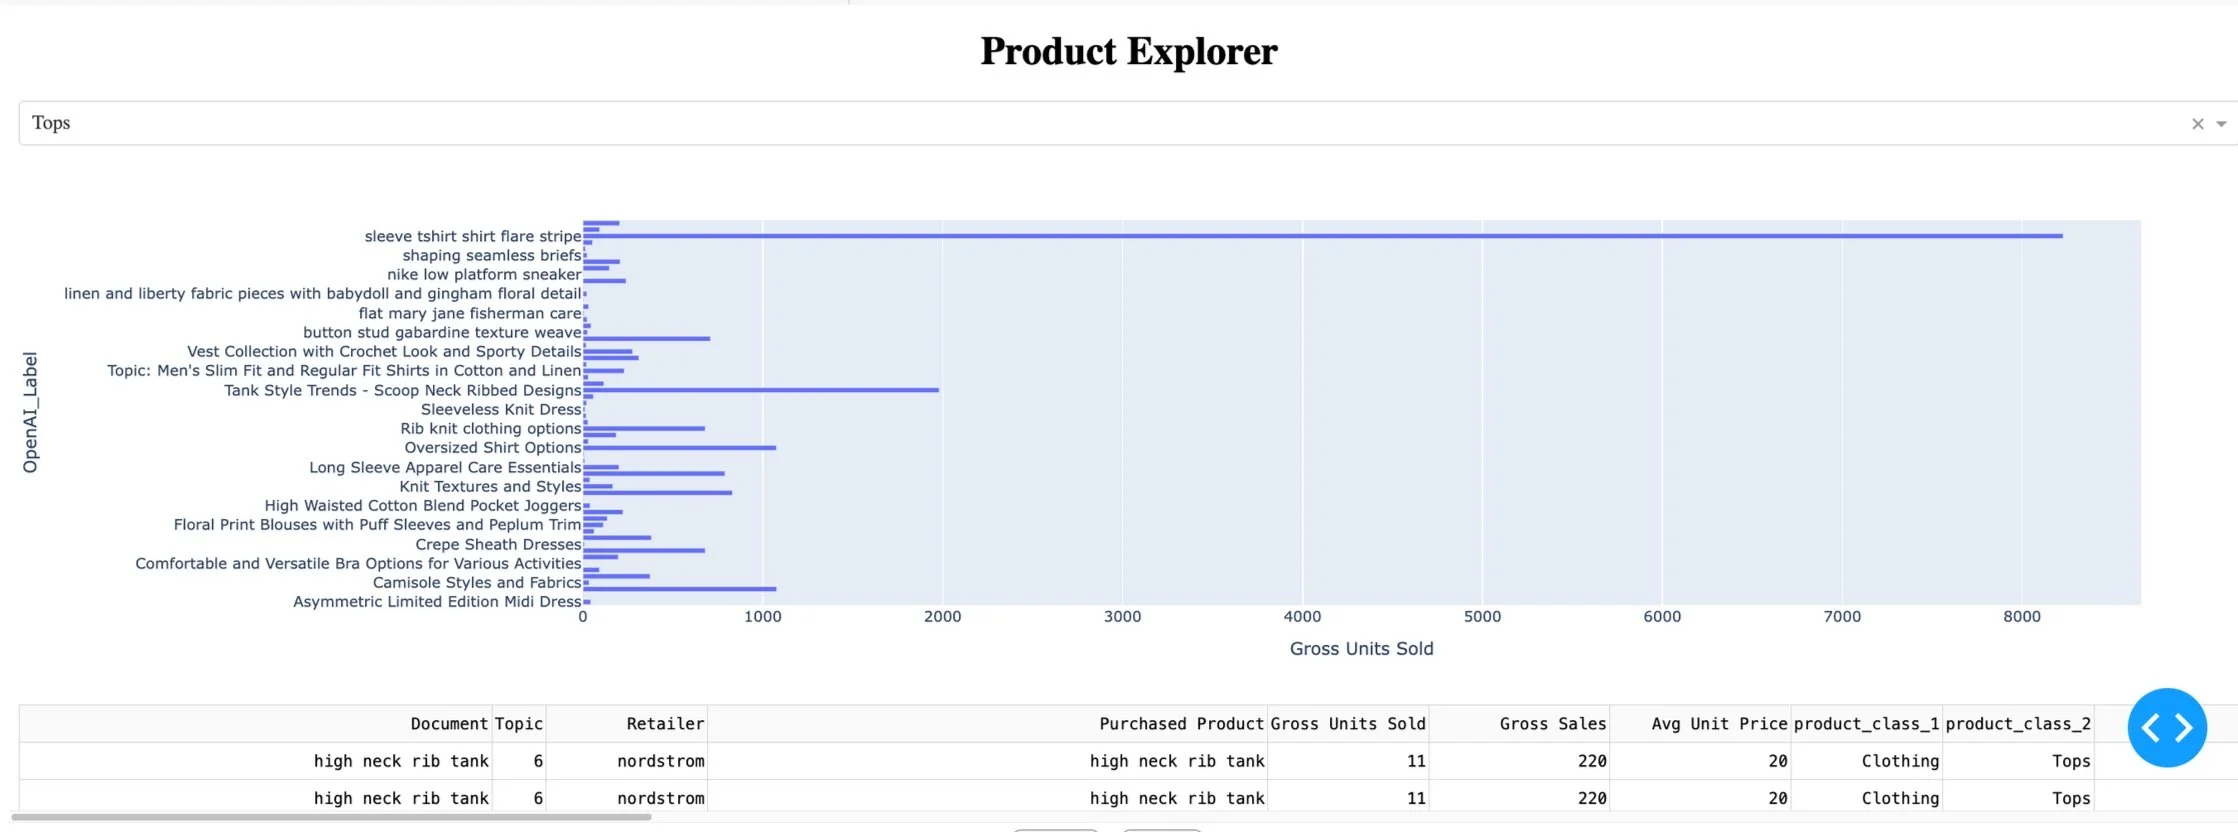
Product Explorer
The final output is an interactive Dash app of a bar chart visualization that I hosted on Heroku for anyone to use. This example is filtered on Tops.
*Heroku app is currently under construction
BERTopic Visualizations

UMAP Visualization
Of product conversion data from Spring 2023
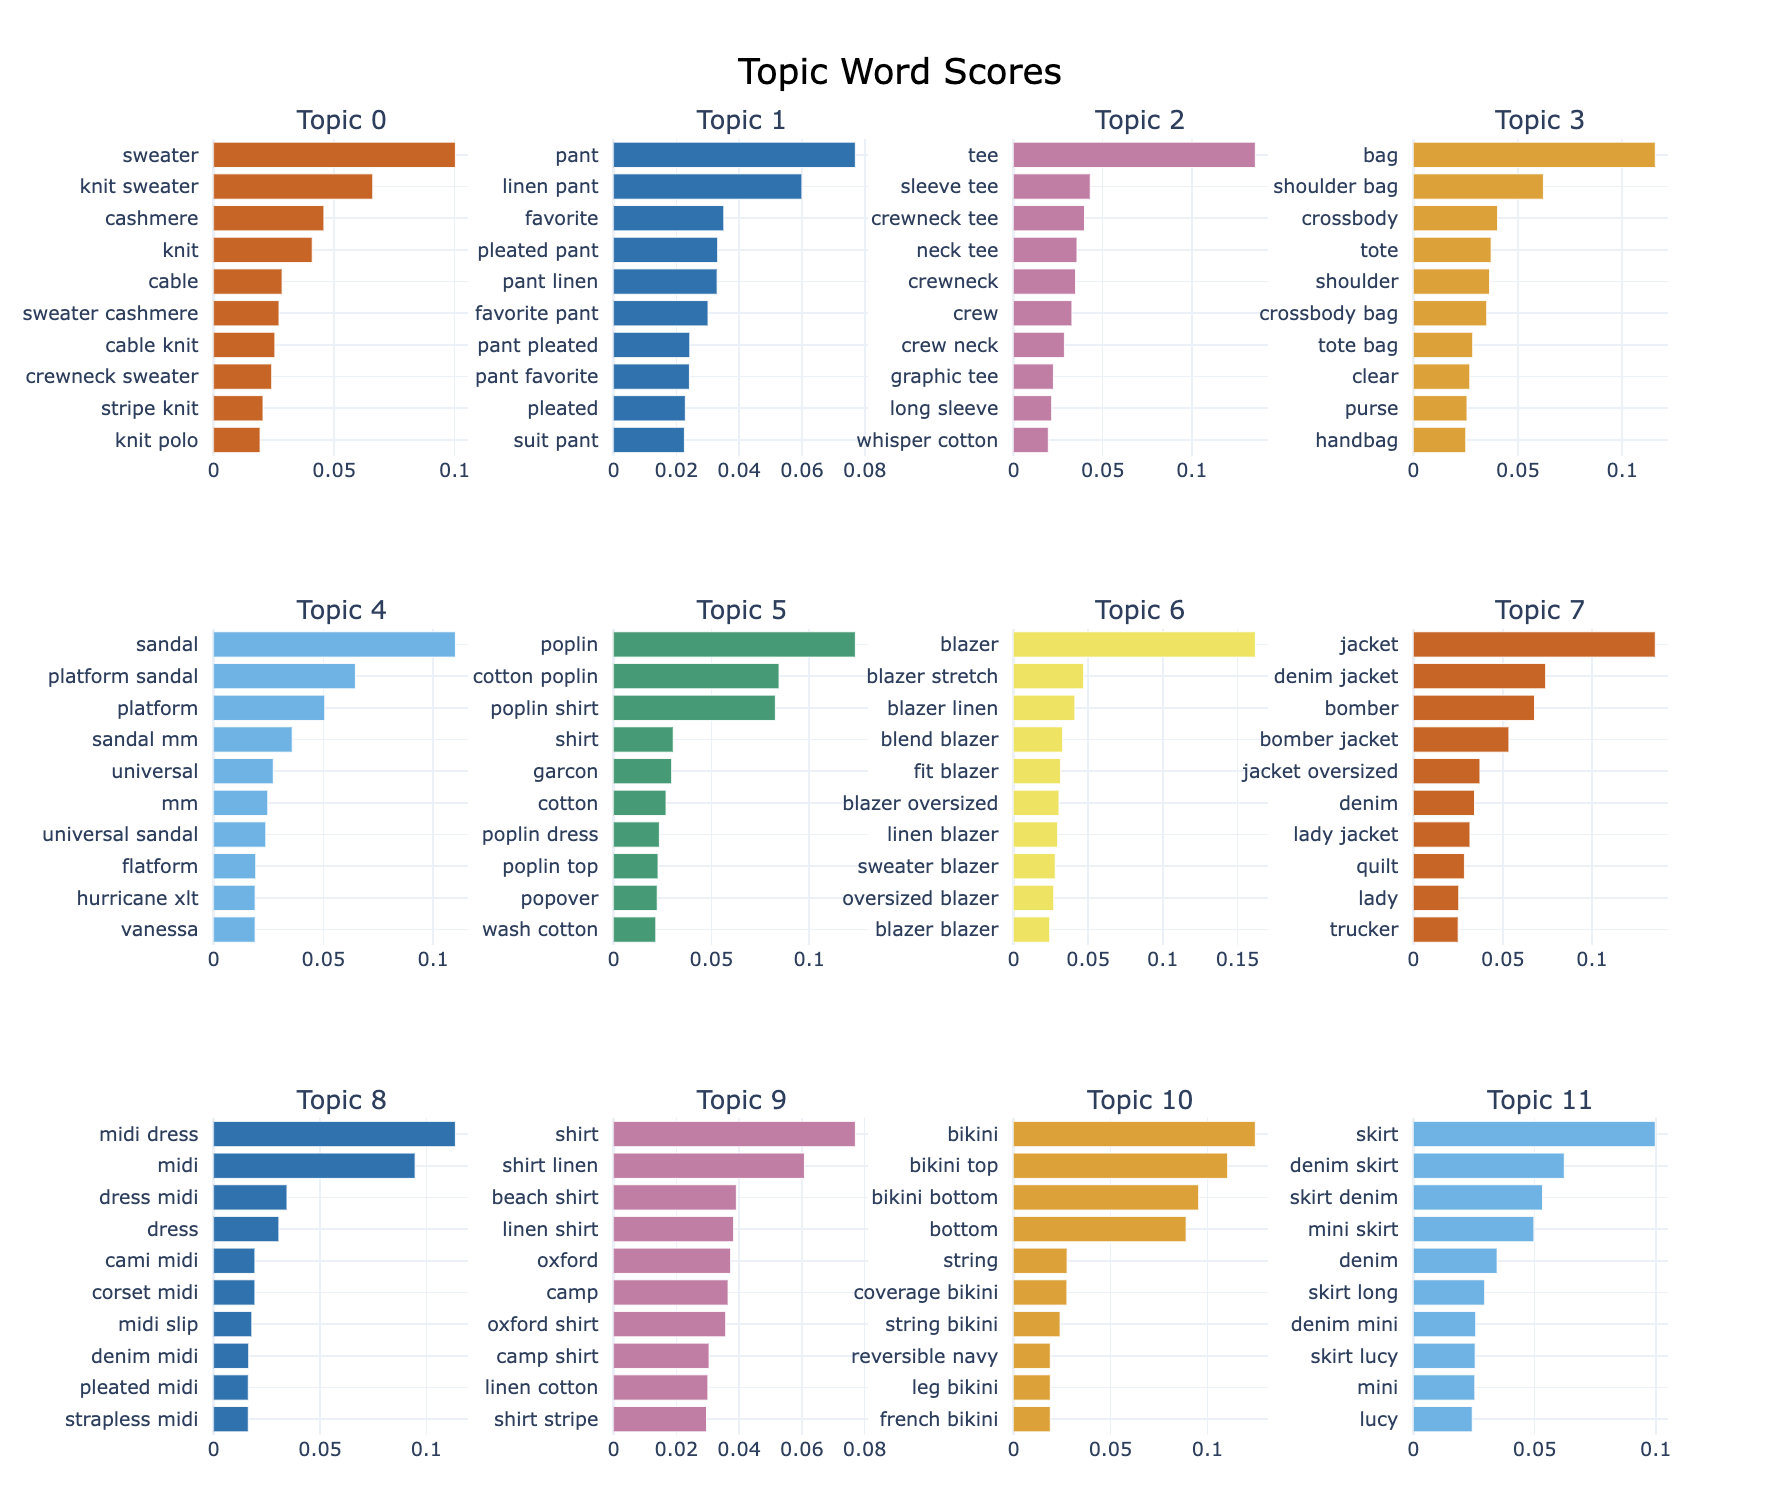
Topic Word Score Bar Charts
Above are a BERTopic visualization that is prebuilt in the library easily visualizes bar charts of your categorized data.
Sankey Diagrams

Filtered Sankey Thread
This example is filtered on Bottoms of product conversion data from Spring 2023.